Pick Mixpanel when your team needs fast funnels, transparent per-event pricing, and quick onboarding. Pick Amplitude when you need deep behavioral cohorting, mature experimentation, and tight warehouse integration. That single trade-off, speed-to-insight versus analytical depth, drives almost every decision in this comparison.
| Dimension | Mixpanel | Amplitude |
|---|---|---|
| Best for | Startups and mid-market teams needing quick time-to-insight | Growth-stage and enterprise teams needing behavioral depth and governance |
| Pricing unit | Per 1,000 events | Monthly Tracked Users (MTUs) |
| Experimentation | Basic split tests and feature flags | Holdouts, causal analysis, advanced statistical controls |
| Time-to-value | Days (fast onboarding, flexible schema) | Weeks (governed taxonomy, richer setup) |
| Warehouse-native | Launched recently; historically pipeline-dependent | Native bidirectional syncs with Snowflake, BigQuery, Redshift |
Three quick signals to self-identify your fit:
- Small team, limited data maturity, event-heavy product: Mixpanel's per-event billing and fast funnel builder will cost less and ship insights faster.
- Growth or enterprise stage, running experiments, warehouse already in place: Amplitude's behavioral cohorts, native experimentation, and reverse-ETL capabilities justify the steeper setup.
- Unsure which billing model wins for your telemetry profile: Run a cost model against your actual event-per-user ratio before signing anything. A parallel run of sufficient duration is the safest validation step before full cutover.
Pro Tip: Before your first vendor call, pull 30 days of event logs and calculate your average events-per-user per month. That single number will tell you which pricing model is cheaper for your product.
Key Takeaways
Mixpanel wins on speed and cost for event-heavy products at early stages; Amplitude wins on depth, experimentation, and warehouse integration for growth-stage and enterprise teams with mature data stacks.
| Point | Details |
|---|---|
| Billing unit is the first decision | Calculate your event-per-user ratio before comparing prices; it determines which model is cheaper for your product. |
| Experimentation depth differs significantly | Amplitude supports holdouts and causal analysis; Mixpanel covers basic split tests and feature flags. |
| Warehouse-first teams favor Amplitude | Native bidirectional syncs with Snowflake, BigQuery, and Redshift reduce the need for a CDP intermediary. |
| Run a 30–60 day parallel period when migrating | Reconciling event counts and cohort definitions between platforms requires at least 30 days of simultaneous instrumentation. |
| SaaS LaunchPad provides a vendor-neutral audit | The 21-discipline product audit delivers a scored evaluation and implementation-ready migration plan for teams choosing between platforms. |
Table of Contents
- How do Mixpanel and Amplitude compare feature by feature?
- Which tool fits your team's actual use case?
- What does each platform actually cost, and what drives the bill?
- How much engineering work does implementation actually take?
- How does each platform fit into your existing data stack?
- What security and compliance checks should you run before signing?
- How should you run the vendor evaluation and what questions should you ask?
- How does the SaaS LaunchPad scorecard help you pick the right tool?
- The part most comparison articles get wrong about this decision
- What SaaS LaunchPad delivers for teams evaluating analytics platforms
- Useful sources for further research
- FAQ
How do Mixpanel and Amplitude compare feature by feature?
Recent product moves in 2024–2026 have widened the practical differences between these two platforms. Warehouse-native modes, behavioral cohorts, and native experimentation have all shifted where the boundary sits. Choosing by data maturity and product complexity is now more important than ever.
Core analytics, funnels, and retention
Mixpanel's funnel builder is genuinely fast. A product manager with no SQL background can assemble a conversion funnel in minutes, filter by property, and export a cohort for a push campaign. G2 reviewers consistently highlight this ease of use and quick time-to-insight as the platform's defining strength in real-world deployments.
Amplitude's behavioral graphs go deeper. Its Compass feature surfaces leading indicators of retention automatically, and its cohort builder lets you define audiences by sequences of events, not just event membership. That distinction matters most when you are trying to answer questions like "which activation path predicts 90-day retention?" rather than "what is my week-1 funnel conversion rate?"
Experimentation and feature flags
Amplitude's experimentation and feature-flagging capabilities are more mature. Amplitude Experiment includes holdouts, mutual exclusion groups, and causal analysis controls that most growth teams at Series B and beyond will eventually need. Mixpanel added feature flags and basic A/B tests, but its statistical depth remains shallower. If your team runs more than a handful of concurrent experiments, Amplitude's controls reduce the risk of interaction effects contaminating results.
Session replay and autocapture
Neither Mixpanel nor Amplitude leads on session replay the way dedicated tools like FullStory or Hotjar do. Mixpanel has added session replay as a bundled feature; Amplitude offers session replay within its Digital Analytics Platform tier. Both are useful for quick qualitative context but are not replacements for a dedicated replay tool on high-traffic products.
Heap takes a different approach entirely: its autocapture model records every interaction by default, which eliminates upfront instrumentation but can generate significant data volume and governance overhead. PostHog also ships autocapture alongside session replay, making it the strongest option for teams that want both in a single open-source package.
AI and automated insights
Both platforms have invested in AI features. Amplitude's Predictive Cohorts and its Ask Amplitude natural-language query interface are the more mature implementations. Mixpanel's AI-powered insights are newer and narrower in scope. Neither platform has yet made AI the primary reason to choose it over the other; treat AI features as a tie-breaker, not a lead criterion.
Full feature comparison
| Dimension | Mixpanel | Amplitude | PostHog | Google Analytics | Heap | Woopra |
|---|---|---|---|---|---|---|
| Best for | Startups, mid-market, fast funnels | Growth/enterprise, deep behavioral analysis | Self-hosting, open-source control | Marketing attribution, traffic analysis | Autocapture, exploratory analysis | CRM lifecycle, journey tracking |
| Core analytics (events, funnels, retention, cohorts) | Strong funnels; flexible schema | Deep cohorts; behavioral graphs; Compass | Strong; open-source | Traffic-focused; limited product depth | Strong via autocapture | Journey-focused |
| Experimentation & feature flags | Basic split tests and flags | Holdouts, causal analysis, advanced controls | Feature flags built-in | None native | Limited | None |
| Session replay / autocapture | Session replay (bundled) | Session replay (Digital Analytics tier) | Autocapture + session replay | None native | Autocapture (core differentiator) | None |
| AI / automated insights | Newer AI insights | Predictive Cohorts, Ask Amplitude | Limited | Basic anomaly detection | Limited | Limited |
| Integrations & warehouse connectors | Warehouse-native (recent); CDP often needed | Native Snowflake, BigQuery, Redshift; reverse ETL | Self-hosted; flexible connectors | Strong marketing integrations | CDP integrations available | CRM-focused integrations |
| Implementation complexity | Low to medium | Medium to high | Medium (self-hosted adds ops burden) | Low | Low (autocapture) | Low to medium |
| Pricing model | Per 1,000 events | Monthly Tracked Users (MTUs) | Free tier; cloud or self-hosted | Free; GA4 360 for enterprise | MTU-based | Free tier; paid plans |
| Security & compliance | SOC 2 Type II | SOC 2 Type II; data residency options | Self-hosted = you control data | Google infrastructure | SOC 2 Type II | SOC 2 Type II |
UI/UX differences that affect non-analyst adoption:
- Amplitude's interface rewards analysts who understand behavioral graph logic; the learning curve is steeper for casual users
- Google Analytics remains the easiest entry point for marketing teams but offers limited depth for product behavioral analysis.
Which tool fits your team's actual use case?
Top reviews converge on a single decision framework: pick the tool that maps to your company stage, event volume, and governance needs. Here is how that plays out across common product profiles.
By company stage:
- Seed / pre-product-market-fit: Mixpanel. Fast setup, no warehouse required, per-event billing stays cheap at low volume. You need answers in days, not weeks.
- Series A / early growth: Mixpanel or Amplitude depending on experiment cadence. If you are running more than two concurrent A/B tests per quarter, Amplitude's experimentation controls start paying off.
- Series B and beyond / PLG motion: Amplitude. Behavioral cohorts, predictive retention signals, and warehouse-native workflows align with the data maturity these teams typically have.
- Enterprise / B2B account-based: Amplitude or a combination. Group analytics (account-level aggregation) is more mature in Amplitude. Woopra is worth evaluating if CRM lifecycle tracking is the primary need.
By product type:
- B2B SaaS with low user counts but high event density per user: Amplitude's MTU billing can be cheaper here. A product with 500 power users generating 10,000 events each per month will pay far less under MTU pricing than per-event pricing.
- Consumer mobile or e-commerce with millions of users and moderate event depth: Mixpanel's per-event model can become expensive at scale. Run the cost model before committing. For e-commerce funnel analysis, Mixpanel's funnel speed is genuinely useful, but watch the event volume.
- AI/ML product or developer tool: PostHog's self-hosted option and open-source flexibility make it the strongest fit for teams that want to own their instrumentation stack. For AI-driven product analytics use cases, both Mixpanel and Amplitude support custom event schemas, but PostHog gives you the raw data without vendor lock-in.
- Marketing-attribution-first: Google Analytics. Neither Mixpanel nor Amplitude is designed for multi-touch attribution across paid channels. Use GA4 for that layer and a product analytics tool for behavioral depth.
Two illustrative decision scenarios:
A Series A fintech with 8,000 monthly active users running three concurrent onboarding experiments needs holdout groups and causal controls. Amplitude is the right call. The MTU billing is predictable, the experimentation layer handles mutual exclusion, and the behavioral cohorts can segment by account tier.
A seed-stage developer tool with 1,200 users but 50,000 events per user per month faces a different math problem. At that event-per-user ratio, Mixpanel's per-event billing could cost significantly more than Amplitude's MTU model. Run the numbers before assuming Mixpanel is cheaper because it is the "startup" option.
When running both tools in parallel makes sense: Teams migrating from one platform to the other should run a 30–60 day parallel instrumentation period to reconcile event counts and cohort definitions. Discrepancies between platforms during this window are normal and expected; they reveal instrumentation gaps, not platform errors.
What does each platform actually cost, and what drives the bill?
The primary billing difference is the unit of measure: Mixpanel charges per 1,000 events, Amplitude charges per Monthly Tracked User. Your event-per-user ratio determines which model is cheaper for your specific telemetry profile.
How the pricing models work
Mixpanel's event-based billing is transparent and predictable when event volume is low or moderate. It rewards lean tracking plans. Every event you fire costs money, which creates a natural incentive to instrument deliberately rather than capturing everything.
Amplitude's MTU model is more predictable for B2B products with a stable, known user base. If you have 2,000 enterprise users who each generate thousands of events per session, you pay for 2,000 MTUs regardless of event depth. That can be a significant cost advantage.
Pricing scenario examples
| Scenario | Profile | Mixpanel estimate | Amplitude estimate | Notes |
|---|---|---|---|---|
| Seed stage | 1,000 MAUs, 200 events/user/month | Low (free tier covers most) | Low (free tier covers most) | Both offer free tiers; cost difference is minimal |
| Mid-market | 20,000 MAUs, 500 events/user/month | Mid-range | Mid-range | Event-per-user ratio near crossover; model both |
| High-event B2B | 500 MAUs, 10,000 events/user/month | High (event volume drives cost) | Low (MTU count is small) | Amplitude wins clearly on cost |
| High-volume consumer | 500,000 MAUs, 150 events/user/month | High (event volume) | High (MTU count) | Both expensive; negotiate volume discounts |
Note: Both vendors publish starting-tier pricing publicly but require a sales conversation for growth and enterprise tiers. Treat the estimates above as directional, not contractual.
Common billing gotchas
- Group analytics add-ons: — Amplitude charges separately for account-level (group) analytics. If you need B2B account rollups, confirm whether that feature is included in your tier before signing.
Pro Tip: When negotiating with either vendor, bring a 12-month event-volume forecast that includes your peak months (product launches, seasonal campaigns). Vendors will often offer volume-based discounts or overage caps when you can show predictable growth rather than unpredictable spikes.
How much engineering work does implementation actually take?
The honest answer: more than either vendor's sales deck suggests, and the gap between "basic setup" and "production-grade taxonomy" is where most teams underestimate the effort.
Autocapture vs. manual instrumentation
The core architectural difference is event-modeling philosophy. Mixpanel favors a flexible, flat event table where you can fire free-form events and properties without enforcing a schema upfront. Amplitude enforces a governed taxonomy to reduce schema drift over time.
Heap's autocapture approach sits at the opposite extreme: it records every click, form fill, and page view automatically, which means zero instrumentation to start but significant governance work later when you need to define what those captured events actually mean.
The operational consequence of autocapture is schema drift. When every interaction is captured by default, your event table grows fast and becomes hard to query without a data dictionary. Teams that start with Heap or autocapture-heavy configurations often spend months retroactively cleaning up event names and property schemas.
Manual instrumentation with a governed tracking plan takes longer upfront but produces cleaner data. Amplitude's taxonomy enforcement is a feature, not a constraint: it prevents the "what does this event mean?" conversation from happening six months after launch.
Estimated implementation timelines
- Basic setup (first funnels live): — Mixpanel: 2–5 days with an existing SDK. Amplitude: 5–10 days including taxonomy setup.
How does each platform fit into your existing data stack?
Your data stack situation, specifically whether you have a warehouse and how central it is to your analytics workflow, is one of the strongest signals for which platform to choose.
Amplitude's suite targets mature data stacks with native warehouse syncs and reverse-ETL capabilities. Its bidirectional connections to Snowflake, BigQuery, and Redshift mean you can query raw event data in your warehouse and push audience segments back into Amplitude for activation. That closed loop is genuinely useful for teams running ML models on behavioral data.
Mixpanel has introduced warehouse-native analytics but historically relied on its own ingestion pipeline. Teams that need warehouse-first workflows often end up adding a CDP like Segment or mParticle, or building custom ETL, to keep their warehouse as the source of truth. That adds cost and operational complexity.
Integration patterns by stack type
- No warehouse yet: — Both platforms work fine. Mixpanel is faster to start; Amplitude gives you a better migration path when you add a warehouse later.
- CRM lifecycle tracking: Woopra is purpose-built for this use case and integrates tightly with Salesforce and HubSpot. Neither Mixpanel nor Amplitude matches Woopra's CRM-native journey tracking.
| Integration need | Recommended tool | Notes |
|---|---|---|
| Warehouse-first analytics | Amplitude | Native bidirectional syncs; reverse ETL built-in |
| Segment CDP as source | Mixpanel or Amplitude | Both have native Segment connectors |
| CRM lifecycle tracking | Woopra | Purpose-built for account journey mapping |
| Open-source / self-hosted | PostHog | Full control over data residency and schema |
| Marketing attribution | Google Analytics | GA4 is the standard for paid-channel attribution |
| Autocapture / no tracking plan | Heap | Zero instrumentation to start; governance work later |
What security and compliance checks should you run before signing?
Both Mixpanel and Amplitude hold SOC 2 Type II certification, which is the baseline expectation for any product analytics vendor handling behavioral data. Beyond that baseline, the checks that matter most depend on your industry and data residency requirements.
Security checklist for vendor evaluation:
- Confirm SOC 2 Type II report is current (within the last 12 months) and request the full report, not just the summary.
- Ask about encryption at rest and in transit. Both platforms use AES-256 at rest and TLS in transit, but confirm the specific cipher suites for your compliance team.
- Verify SSO/SAML support and whether it is included in your tier or an add-on.
- Ask about data residency options. Amplitude offers EU data residency on enterprise plans. Mixpanel's data residency options are more limited; confirm the specific region where your data is stored.
- Request the data deletion SLA. GDPR and CCPA require the ability to delete a specific user's data on request. Both platforms support this, but the SLA for deletion completion varies.
- Confirm PII handling policies. Neither platform should be used to store raw PII (names, emails, SSNs) in event properties. Use hashed or anonymized identifiers instead.
- Ask about audit logs for data access. Enterprise plans on both platforms include admin audit logs; confirm this is available in your tier.
Data retention:
Free and starter tiers cap historical data at 12 months on Mixpanel and 12 months on Amplitude. Enterprise plans extend this, but confirm the exact retention window in your contract before signing. Losing historical cohort data mid-analysis is a real operational problem.
Pro Tip: A warehouse-first architecture reduces vendor lock-in and simplifies compliance significantly. If your raw event data lives in Snowflake or BigQuery, you can switch analytics vendors without losing historical data. Amplitude's native warehouse sync makes this easier to implement than Mixpanel's historically pipeline-dependent approach.
How should you run the vendor evaluation and what questions should you ask?
A structured evaluation process prevents the most common mistake in analytics vendor selection: choosing based on a polished demo rather than a realistic PoC against your actual data.
Sample PoC template
What to instrument: Your three core activation events, one retention metric (e.g., "returned within 7 days after activation"), and one conversion funnel (signup to paid).
Success metrics for the PoC: Can a non-technical product manager build the retention chart without help? Does the funnel conversion rate match your existing data within 5%? How long did instrumentation take?
PoC length: 30 days minimum. 60 days if you are migrating from an existing platform and need to reconcile historical data.
Red flags that should pause a buying decision
- Opaque overage terms or refusal to put overage rates in writing before contract signing.
- No self-serve cost modeling tool or unwillingness to provide a written cost estimate based on your event volume.
- Poor or absent reverse-ETL support when your team has a warehouse and plans to run ML models on behavioral data.
- Missing governance tooling (no event schema validation, no property type enforcement) for a team that already has a complex tracking plan.
- A sales process that skips the PoC and pushes directly to a 12-month contract.
For a structured approach to selecting analytics and product tools, a documented evaluation framework reduces the risk of a costly wrong choice.
How does the SaaS LaunchPad scorecard help you pick the right tool?
A weighted scorecard removes the subjectivity from the final decision and gives you a document you can share with engineering, finance, and leadership to align on the choice.
Weighted evaluation scorecard
| Criterion | Weight | Mixpanel signal | Amplitude signal | Suggested cutoff |
|---|---|---|---|---|
| Data maturity (warehouse in place, governed taxonomy) | 25% | Low maturity: favor Mixpanel | High maturity: favor Amplitude | Score ≥ 4/5 on maturity → Amplitude |
| Experiment needs (concurrent tests, causal controls) | 20% | Basic tests only | Advanced holdouts and causal analysis | ≥ 3 concurrent experiments → Amplitude |
| Integration fit (warehouse, CDP, CRM) | 20% | CDP often needed for warehouse-first | Native warehouse syncs | Warehouse-first requirement → Amplitude |
| Time-to-value (days to first insight) | 15% | Days | Weeks | Speed critical → Mixpanel |
| Cost predictability (billing model vs. your telemetry) | 10% | Event-per-user ratio drives cost | MTU count drives cost | High events/user → model both |
| Governance needs (schema enforcement, audit logs) | 10% | Flexible; less enforcement | Enforced taxonomy; audit logs | Strict governance → Amplitude |
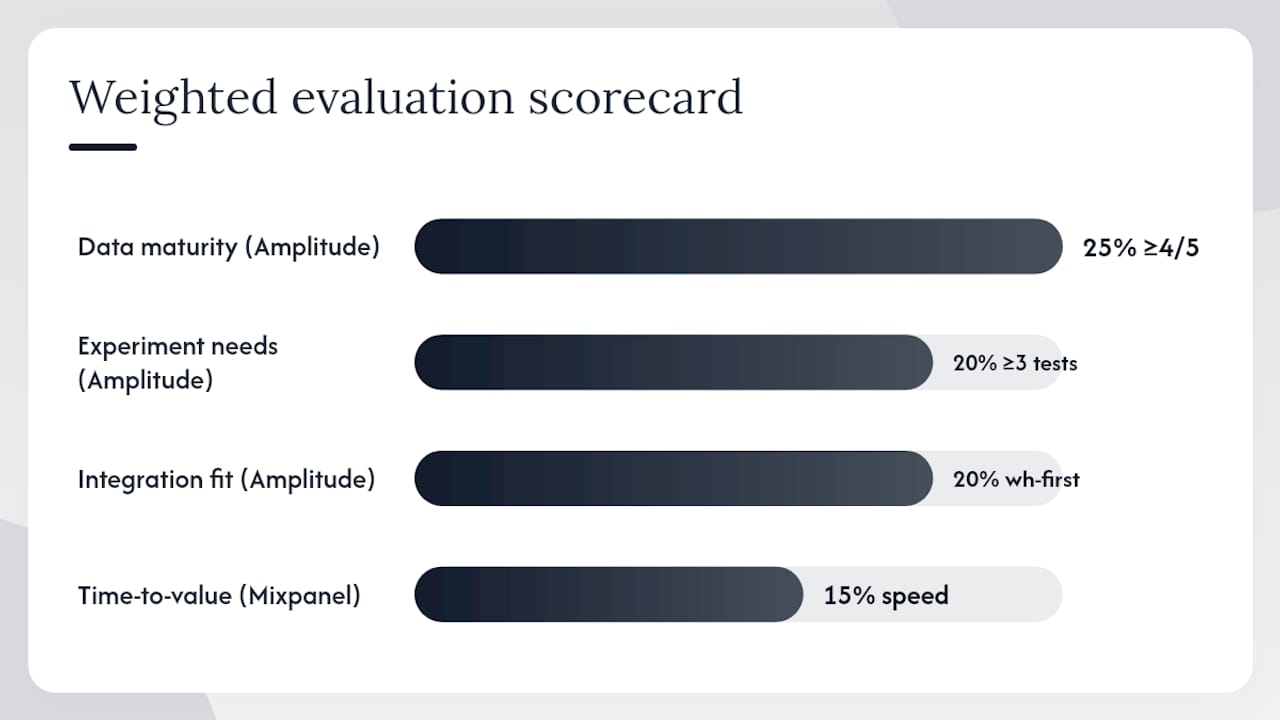
Score interpretation: If Amplitude scores higher on three or more of the top four criteria (data maturity, experiment needs, integration fit, time-to-value), start with Amplitude. If Mixpanel scores higher on time-to-value and cost predictability and your experiment needs are basic, start with Mixpanel and plan a documented migration path for when governance and experimentation needs grow.
Phased rollout timeline
Phase 1: Pilot (weeks 1–4). Instrument your three core events on the chosen platform. Build one funnel and one retention chart. Validate event counts against your existing data source.
Phase 2: Parallel run (weeks 5–12). If migrating, fire events to both platforms simultaneously. Compare funnel conversion rates and cohort sizes weekly. Resolve discrepancies above 5%.
Phase 3: Cutover (week 12–16). Decommission the old platform's SDK. Migrate dashboards and alerts. Train non-technical stakeholders on the new UI.
Phase 4: Validation (weeks 16–20). Run your first experiment on the new platform. Confirm that cohort definitions match your warehouse data. Review governance: are undeclared events being flagged?
SaaS LaunchPad's 21-discipline product audit covers competitive intelligence, platform audit, and implementation sprint planning, which maps directly to the pilot and parallel-run phases above. Teams that want a vendor-neutral scorecard and a migration plan with prioritized tasks and time estimates can use the audit as the starting point for their evaluation.
The part most comparison articles get wrong about this decision
There is a version of this comparison that gets written every year, and it always ends the same way: Mixpanel for startups, Amplitude for enterprise. That framing is not wrong, but it is incomplete in a way that causes real problems.
The actual decision is not about company size. It is about event-per-user ratio, experiment cadence, and whether your warehouse is already the source of truth for your business. A 10-person team with a data-mature stack running four concurrent experiments every quarter should be on Amplitude. A 200-person company with a simple consumer app and 80 events per user per month might be perfectly served by Mixpanel for years.
The mistake most teams make is choosing based on the demo experience rather than the cost model and the governance fit. Amplitude's interface is impressive in a demo. Mixpanel's funnel builder feels fast and intuitive. Neither of those impressions tells you what your bill will look like in 18 months or whether your data team will spend three months cleaning up schema drift.
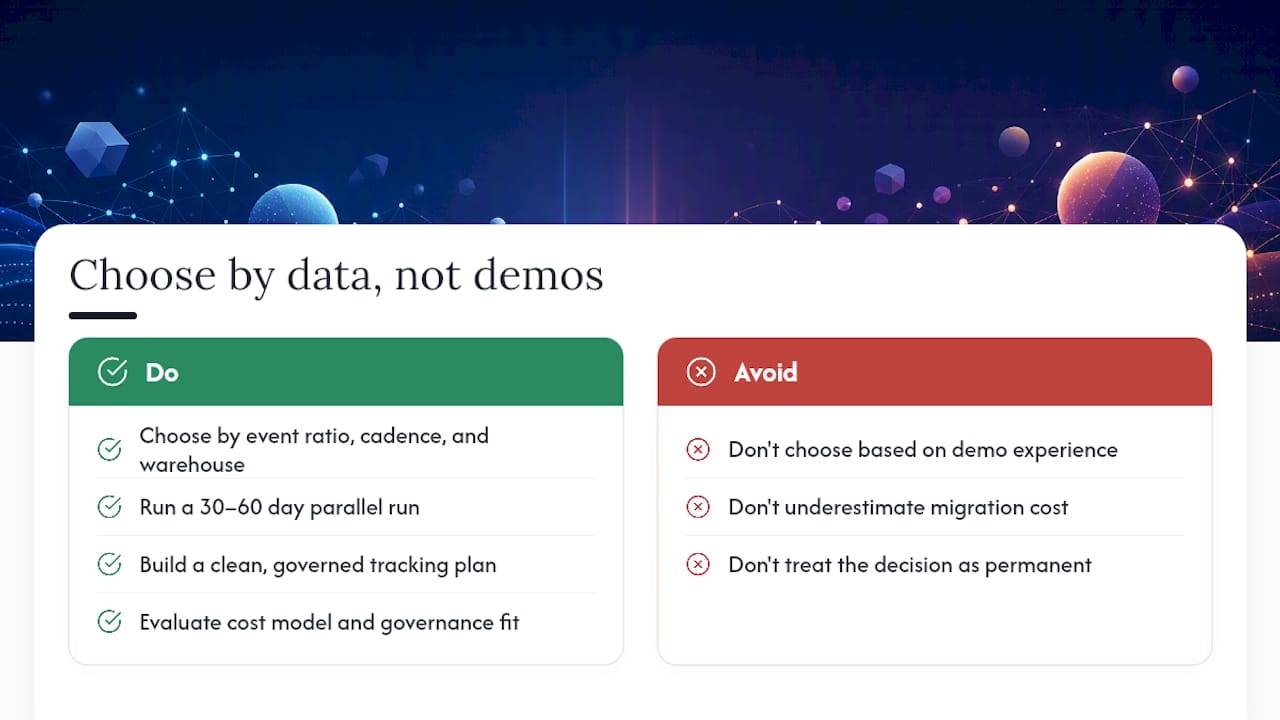
The second mistake is underestimating the migration cost. Switching platforms is not just a technical exercise. It means reconciling cohort definitions, retraining stakeholders, rebuilding dashboards, and often discovering that your tracking plan was less clean than you thought. That is why the 30–60 day parallel run is not optional. Teams that skip it almost always find a discrepancy they cannot explain after cutover, and that discrepancy erodes trust in the new platform before it has had a chance to prove itself.
The third mistake, and the one that costs the most, is treating the analytics vendor decision as permanent. Both platforms have improved significantly in 2024–2026. Amplitude has closed some of the ease-of-use gap. Mixpanel has made progress on warehouse-native workflows. The right answer today may not be the right answer in two years, and the teams that build a clean, governed tracking plan from the start are the ones that can migrate without losing their historical data.
What SaaS LaunchPad delivers for teams evaluating analytics platforms
Choosing between Mixpanel and Amplitude is one decision. Knowing whether your current product instrumentation is actually ready to support either platform is a different, harder question. Most teams discover the gap after they have already signed a contract.
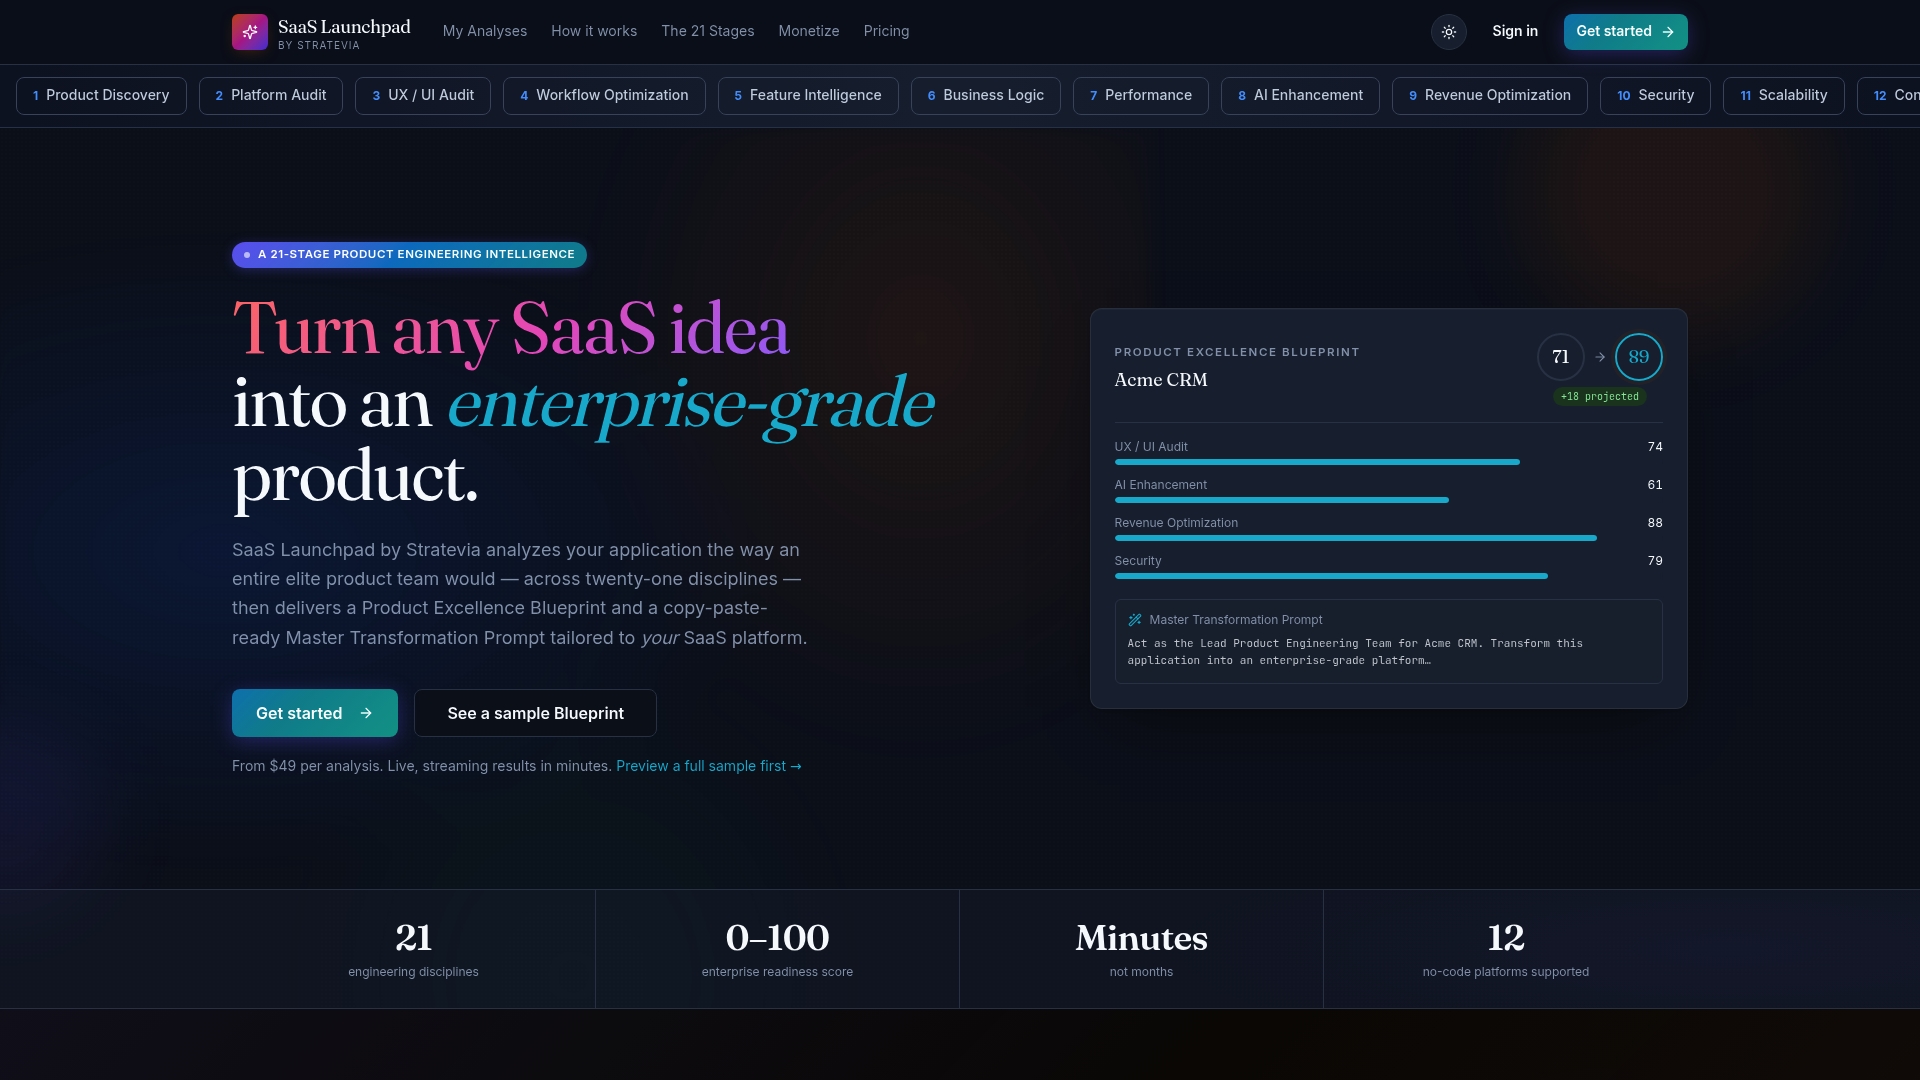
SaaS LaunchPad's 21-discipline product audit analyzes your application across platform audit, workflow optimization, feature evaluation, competitive intelligence, and implementation sprint planning. For teams in the middle of an analytics vendor evaluation, the audit produces a scored vendor-fit assessment, a prioritized event-mapping template, and a phased migration plan with time estimates, so you go into vendor negotiations knowing exactly what your instrumentation gaps are and how long it will take to close them.
What a typical analytics evaluation engagement includes:
- Vendor-neutral scorecard scored against your actual telemetry profile and data stack
- Event-mapping template with naming conventions and property schema recommendations
- PoC checklist and 30-day parallel-run validation plan
- Prioritized implementation roadmap with effort estimates by phase
Purchase an analysis credit at SaaS LaunchPad and receive your Product Excellence Blueprint and Master Transformation Prompt within the engagement window. No subscription, no retainer. Credits never expire.
Useful sources for further research
The sources below are the most useful starting points for teams that want to go deeper on specific dimensions of this comparison.
Vendor documentation and official resources:
- Amplitude vs Mixpanel: Product Analytics for AI and E-commerce Apps in 2026 — Contra Collective
- Mixpanel vs Amplitude: 5 Differences That Matter 2026 | US Tech Automations
- Mixpanel vs Amplitude: Which Analytics Tool Should You Choose?
- Mixpanel vs Amplitude: Is There a Better Alternative?
- Mixpanel vs Amplitude: Which is Better in 2026? | Toolradar
- mParticle blog: Mixpanel alternatives
- g2.com
- g2.com
Third-party comparison resources:
- Amplitude vs Mixpanel: Product Analytics for AI and E-commerce Apps in 2026 (Contra Collective): Best for understanding recent product moves and warehouse-native positioning.
- Mixpanel vs Amplitude: 5 Differences That Matter 2026 (US Tech Automations): Best for the billing-unit comparison and event-per-user cost modeling.
- Mixpanel vs Amplitude: Which Analytics Tool Should You Choose? (Edana): Best for a balanced speed-vs-depth framing.
- Mixpanel vs Amplitude: Is There a Better Alternative? (Userpilot): Best for experimentation feature depth and alternatives overview.
- Mixpanel vs Amplitude: Which is Better in 2026? (Toolradar): Best for a quick decision-framework summary.
- mParticle: Mixpanel alternatives: Best for understanding warehouse-first integration gaps and CDP use cases.
Recommended next actions:
- Pull 30 days of event logs and calculate your average events-per-user per month. Use that number to model costs on both billing models.
- Run a 30-day PoC against your three core product questions before signing any contract.
- If your tracking plan is undocumented or your instrumentation is inconsistent, schedule a platform audit before starting the vendor evaluation. Cleaning up your data model first will make the PoC results meaningful.
FAQ
Which is better for me: Amplitude, Mixpanel, or Heap?
Mixpanel is the fastest to start and cheapest for event-heavy products at early stages; Amplitude is the stronger choice for teams running experiments and working with a data warehouse; Heap suits teams that want automatic event capture without upfront instrumentation but requires governance investment later.
Who are Mixpanel's main competitors?
Mixpanel's closest competitors are Amplitude, PostHog, and Heap for product analytics; Google Analytics for web and marketing attribution; and Woopra for CRM-focused journey tracking.
What are Amplitude's main competitors?
Amplitude competes most directly with Mixpanel on product behavioral analytics, with PostHog for developer-centric and self-hosted use cases, and with Mixpanel alternatives like Heap for autocapture-first teams.
Is Amplitude a legitimate company?
Yes. Amplitude is a publicly traded company (Nasdaq: AMPL) and holds SOC 2 Type II certification. G2 reviewers consistently rate its behavioral analytics and cohort features highly, though onboarding complexity and pricing opacity are the most common criticisms.
When should I run both Mixpanel and Amplitude at the same time?
Run both simultaneously during a migration, for a minimum of 30 days, to reconcile event counts and cohort definitions before decommissioning the old platform. Discrepancies above 5% between platforms typically signal an instrumentation gap that needs to be resolved before cutover.