
Funnel analysis is the practice of tracking how users move through defined stages of your product, from first touch to paid conversion and beyond, so you can see exactly where they drop off. For SaaS teams, the goal isn't the chart itself. It's finding the single highest-impact bottleneck and prioritizing the experiment that fixes it. Start by picking one funnel that matters most to revenue right now and running a tracking audit on it before you touch a single button on the page.
TL;DR:
- Tracking the trial-to-paid funnel is crucial since drop-offs at the billing stage often indicate pricing confusion rather than lack of interest.
- Building clear, decision-based funnel steps with specific entry and exit criteria helps ensure reliable data and aligned team understanding.
- Prioritizing fixes based on proportional drop-off and business impact improves efficiency instead of relying on gut feeling or raw numbers alone.
- Conducting cohort analysis and tracking time-to-convert distributions can reveal whether improvements are lasting or just short-term anomalies.
- An external product audit streamlines diagnosis, highlights high-impact issues, and creates actionable, phased plans for fixing funnel friction points.
Table of Contents
- What Are the Main SaaS Funnel Examples to Analyze First?
- How Do You Define Funnel Steps With Clear Entry and Exit Criteria?
- Which Metrics Actually Tell You Where to Optimize?
- What Does a Funnel Tracking Checklist Look Like?
- What Tools Belong in a Funnel Analytics Stack?
- How Do You Diagnose Drop-Off and Prioritize the Right Experiment?
- How Does Cohort Analysis Reveal What Aggregate Funnels Miss?
- How Should You Visualize Funnel Data for Stakeholders?
- How Does a Structured Product Audit Speed Up Funnel Fixes?
- What Habits Actually Make Funnel Analysis Repeatable?
- Get a Structured Diagnosis of Your Funnel Instead of Guessing
- Sources
- FAQ
What Are the Main SaaS Funnel Examples to Analyze First?
Not every funnel deserves attention this quarter. The trick is matching the funnel to the question you're actually trying to answer, because funnels should be tailored to your specific product and industry rather than copied from a generic template. Here are the five that show up in almost every SaaS business, and what each one is actually diagnosing.
- Marketing to signup funnel (ad or organic click → landing page view → form start → account created): this diagnoses traffic quality and landing page friction. A steep landing page to signup drop usually points to message mismatch or a form asking for too much too soon.
- Onboarding to activation funnel (account created → first key action → "aha moment" reached): this diagnoses onboarding UX; learn more about healthcare-focused onboarding guidance to apply tailored approaches in regulated environments. If a low percentage of new signups hit your activation event within the first session, your setup flow is probably too long or too vague about what to do first.
- Trial to paid funnel (trial start → feature adoption milestone → billing page view → card added): this diagnoses product value realization and monetization friction. Watch specifically for drop-off at the billing page, which often signals pricing confusion rather than a lack of interest.
- Free to paid upgrade funnel (usage limit hit → upgrade prompt seen → plan selected → payment completed): this isolates pricing page performance from product value, since the user has already decided the product works.
- Retention and expansion funnel (renewal date approaching → usage check-in → upsell offer seen → plan expanded): this diagnoses account health and expansion readiness, and it is the funnel most teams under-instrument because it doesn't feel as urgent as new signups.
Run each of these as a strict, ordered sequence rather than a loose set of milestones. Sequential or strict-order funnel modes change how conversions get counted, so a user who reaches step three without passing through step two shouldn't count as converted at all. That distinction alone will change your numbers the first time you turn it on.
How Do You Define Funnel Steps With Clear Entry and Exit Criteria?
A funnel step is only useful if two people on your team, looking at the same data, would draw the same line. Vague steps produce vague conclusions, and vague conclusions get ignored by engineering. Follow this sequence when building any new funnel.
- Anchor each step to a value milestone, not a page view. "Viewed pricing page" is weak. "Clicked upgrade CTA with plan selected" is a real decision point.
- Write a one-sentence entry definition and a one-sentence exit definition for every stage. If you can't write both in a single sentence each, the step is probably two steps disguised as one.
- Cap the sequence at roughly eight steps. Beyond that, tracking accuracy degrades and stakeholders lose the thread of what the funnel is even measuring.
- Split long flows into chained funnels when a process spans acquisition and activation, or crosses from online to offline sales. Analysts recommend splitting into acquisition and activation funnels and stitching results by shared identifiers in the warehouse rather than forcing one oversized funnel to do both jobs.
- Decide identity resolution rules before you launch the funnel, not after. If a user switches from mobile to desktop mid trial, will your funnel recognize them as the same person? Answer that in the design phase.
Pro Tip: Before you build a new funnel in your analytics tool, write its step definitions in a shared doc first and have someone outside the team read them cold. If they can't guess what event fires each step, rewrite it.
Getting this right matters more than picking the fanciest tool. A beautifully visualized funnel built on inconsistent step definitions will still send your team chasing the wrong fix.
Which Metrics Actually Tell You Where to Optimize?
Conversion rate alone tells you less than most product managers assume. SaaS teams get a fuller picture by tracking three metric families together: conversion, velocity, and efficiency, then reading them jointly rather than one at a time.
- Conversion rate per stage: the count of users completing a stage divided by the count who entered it. Calculate this stage by stage, never as one blended top-to-bottom number, or you'll hide exactly the bottleneck you're looking for.
- Time-to-convert (velocity): how long users take to move from one stage to the next. Look at the median first, then the tail. A funnel with a strong median but a long tail usually means a segment of users is getting stuck on something specific, like a permissions request or an integration setup.
- Customer acquisition cost (CAC) by channel: what it costs to move a lead into your funnel at all, segmented by source.
- LTV to CAC ratio: whether the customers a given channel or funnel produces are worth what you spent to acquire them.
A quick gut check: if your trial to paid conversion rate looks healthy but your LTV:CAC ratio is weak, the funnel isn't broken. Your targeting is. That's a very different fix than an onboarding redesign, and confusing the two wastes a sprint.
The most common trap here is comparing your numbers against generic industry benchmarks pulled from a blog post. Conversion benchmarks vary considerably by stage and industry, and internal historical baselines are almost always the more honest comparison. Your own funnel from six months ago is a better yardstick than someone else's average.
What Does a Funnel Tracking Checklist Look Like?
Bad data produces confident, wrong conclusions faster than no data does. Fixing tracking integrity before running experiments is the unglamorous step almost every optimization playbook lists first, and almost every team skips.
Run this checklist before you trust a single funnel report:
- UTM parameters standardized across every ad platform, email tool, and landing page, using one naming convention documented somewhere everyone can find it.
- Lifecycle events instrumented consistently, so "trial started" fires from the same trigger in every part of the app, not from three slightly different backend calls.
- Offline and sales-assisted conversions captured, so a deal closed by an account executive shows up in the same funnel as a self-serve signup.
- Cost data connected to conversion data, so CAC calculations don't live in a separate spreadsheet nobody updates.
- Server-side tracking or a Conversion API layer in place for high-value events, since browser-based tracking alone increasingly misses conversions due to ad blockers and cookie restrictions.
- Identity stitching rules documented, so a user who signs up on mobile and upgrades on desktop is tracked as one journey, not two.
For B2B SaaS specifically, a pragmatic multi-touch attribution model beats obsessing over perfect single-touch accuracy. Customer journey analytics unifies cross-channel data and identity resolution to show which touches actually influenced a conversion, which matters more in B2B where deals touch five or six channels before anyone signs anything.
Pro Tip: Run a two-week data integrity test before launching any new experiment: manually walk five real user sessions through your funnel and confirm every event fired in the right order. If even one session breaks the sequence, fix tracking before you fix the product.
What Tools Belong in a Funnel Analytics Stack?
Choosing tools by category, not by brand name, keeps the decision grounded in what your team actually needs. A working stack has six layers, and most teams are missing at least one.
- Event capture: the raw pipe that fires and collects every user action, ideally with server-side options for the events that matter most.
- In-product analytics: the layer where you build and view funnels, cohorts, and path analysis day to day.
- Customer journey analytics or identity layer: unifies cross-channel touches into one resolved identity, which is where linear funnels and broader journey data start to complement each other.
- ETL and data warehouse: where raw events land for SQL access, longer retention, and joins against billing or CRM data that in-product tools can't reach.
- BI and dash boarding: where funnel findings get turned into something a non-analyst stakeholder can act on.
- Experimentation platform: where you run and measure the A/B tests your funnel diagnostics point toward.
Pick each layer on latency (how fast can you see today's data), SQL access (can an analyst query raw events directly), identity resolution quality, and integration cost with your existing CRM or billing system, in roughly that order of priority. AI-assisted diagnostic features, now common across SaaS analytics tools, can flag anomalies and suggest likely causes faster than a manual review. Verify every AI-generated suggestion against the raw event data before you act on it. AI is a research assistant here, not a decision-maker.
How Do You Diagnose Drop-Off and Prioritize the Right Experiment?
Most teams pick experiments by gut feeling or by whoever argued loudest in the planning meeting. A structured prioritization framework beats both, and it doesn't take long to run.
- Rank stages by proportional drop-off, not raw numbers. Losing 40% of users at a low-traffic step matters less than losing 15% at your highest-volume stage.
- Weight each candidate by business impact. A fix to your trial-to-paid step is usually worth more than the same percentage-point lift at the top of the funnel, since it's closer to revenue.
- Factor in velocity, not just conversion. Small lifts that speed up progression through a stage often compound harder than larger lifts that only move percentage points slowly, because faster movement means more completed cycles per quarter.
- Write the hypothesis before you write the test plan: what you believe is causing the drop, what you'll change, and what result would prove or disprove it.
- Define your primary metric and one guardrail metric before launch, so a lift in conversion that tanks activation quality doesn't get called a win.
- Segment results by acquisition channel and plan tier before declaring a winner. A change that helps enterprise trials can hurt self-serve signups in the same test.
The experiment types that move funnel metrics most reliably are onboarding flow changes, pricing page copy tests, and form-field reduction, especially when session-level analysis pairs with the funnel report to confirm exactly where users hesitate or abandon. A structured onboarding checklist is a good starting point if activation is your prioritized bottleneck.
Pro Tip: When a single-page A/B test can't move the number enough, escalate to a cross-functional sprint. Onboarding and pricing friction usually involve product, design, and billing logic at once, and a two-week sprint with all three in the room outperforms three sequential single-owner fixes.
How Does Cohort Analysis Reveal What Aggregate Funnels Miss?
An aggregate funnel blends every signup from the last ninety days into one number, which flattens exactly the differences you need to see. Cohortized funnel views and time-to-convert analyses reveal patterns that aggregate funnels hide, particularly whether an experiment's effect actually holds up over time.
- Build cohorts by signup week or month, then run the same funnel definition against each cohort separately.
- Compare cohorts side by side to see whether a recent onboarding change genuinely improved activation, or whether this month just happened to bring in a stronger batch of users.
- Read time-to-convert as a distribution, not a single average. The median tells you what's typical; the 90th percentile tells you who's stuck, and that tail often points straight at a specific product friction point.
- Track cohort behavior for several weeks past the initial conversion event to confirm an experiment's lift persists into retention, rather than just goosing the initial signup number.
A detailed cohort retention guide walks through building these views in more depth if this is new territory for your team.
How Should You Visualize Funnel Data for Stakeholders?
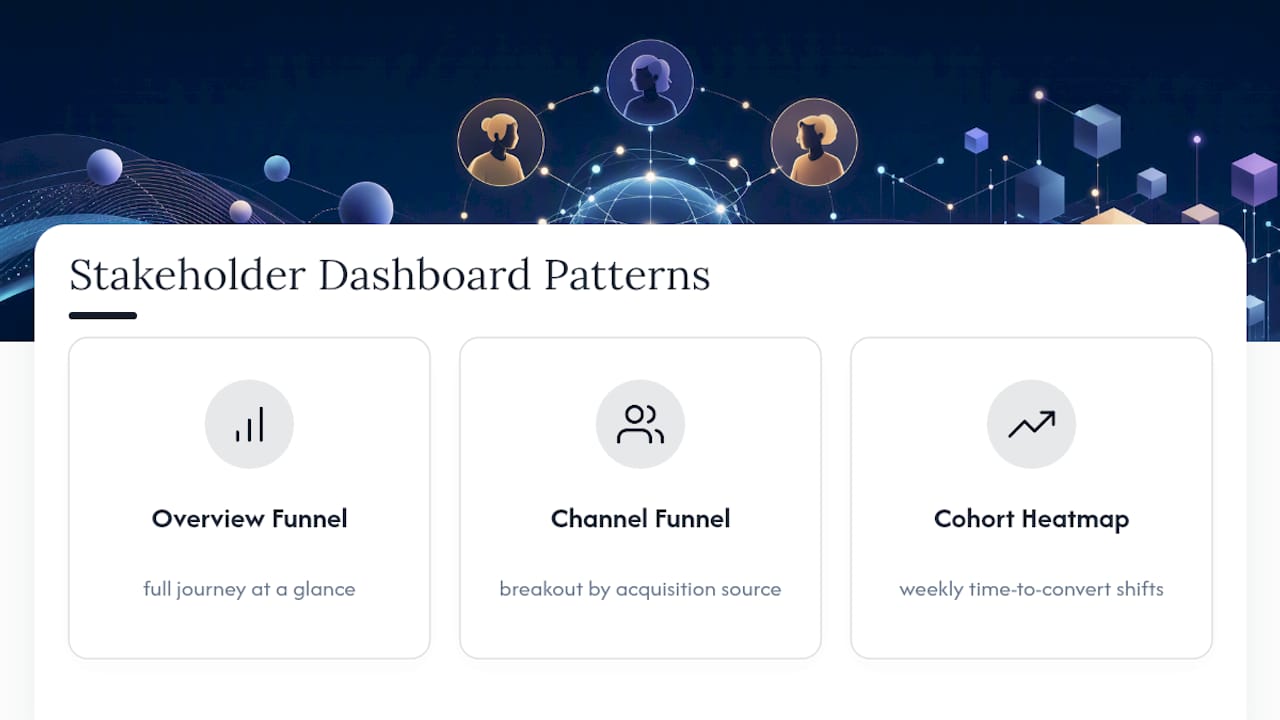
A dashboard that only an analyst can read doesn't change anything. Three visual patterns cover almost every stakeholder need: an overview funnel showing the full journey at a glance, a by-channel funnel breaking the same journey out by acquisition source, and a cohort velocity heatmap showing how time-to-convert shifts week over week.
Pair every dashboard with a short narrative, not just a chart: state the insight, quantify the impact, and name the recommended action in three sentences or less. Skip the temptation to cram ten metrics onto one screen. The most common visualization mistake is mixing raw counts and percentages on the same axis, which makes a chart technically accurate and practically unreadable to anyone outside the data team.
How Does a Structured Product Audit Speed Up Funnel Fixes?
An external, structured audit can compress weeks of internal debate into a prioritized list, particularly when a team is too close to its own product to see the obvious friction point. SaaS LaunchPad's 21-discipline product engineering review is built around exactly this idea: mapping funnel levers like tracking gaps, onboarding UX, instrumentation quality, and experiment readiness against a full-product diagnostic instead of a single narrow audit.
- The output includes a Product Excellence Blueprint that ranks issues by expected impact, not just severity.
- Teams get a Master Transformation Prompt built for direct use in major no-code and low-code platforms.
- Fixes get sequenced into a phased execution plan, so engineering isn't guessing what to tackle first.
Bringing in this kind of review makes the most sense when internal teams are too stretched, too close to the product to spot the obvious gap, or need outside validation before a funding round or a major platform migration.
What Habits Actually Make Funnel Analysis Repeatable?
Most teams don't fail at funnel analysis because they lack a tool. They fail because they treat it as a one-time audit instead of a habit. Pick one bottleneck, fix it, measure it, and only then move to the next one. Chasing three fixes at once means you'll never know which one actually worked.
Give one person clear ownership of the follow-up, with a real deadline for reviewing results, not a vague "let's check back sometime." And write down what you tested and what happened, even the failures. The team that documents a failed pricing page test saves the next person from repeating it eighteen months later.
— Gregory Cornelius
Get a Structured Diagnosis of Your Funnel Instead of Guessing
Most teams optimize funnels the slow way: a dashboard nobody fully trusts, a debate about which fix matters most, and a sprint spent on the wrong one. A faster diagnostic path for that same problem reviews your product across 21 disciplines, tracking integrity, onboarding, UX, and experimentation readiness included, and hands you a prioritized fix list instead of a pile of raw metrics to interpret yourself.
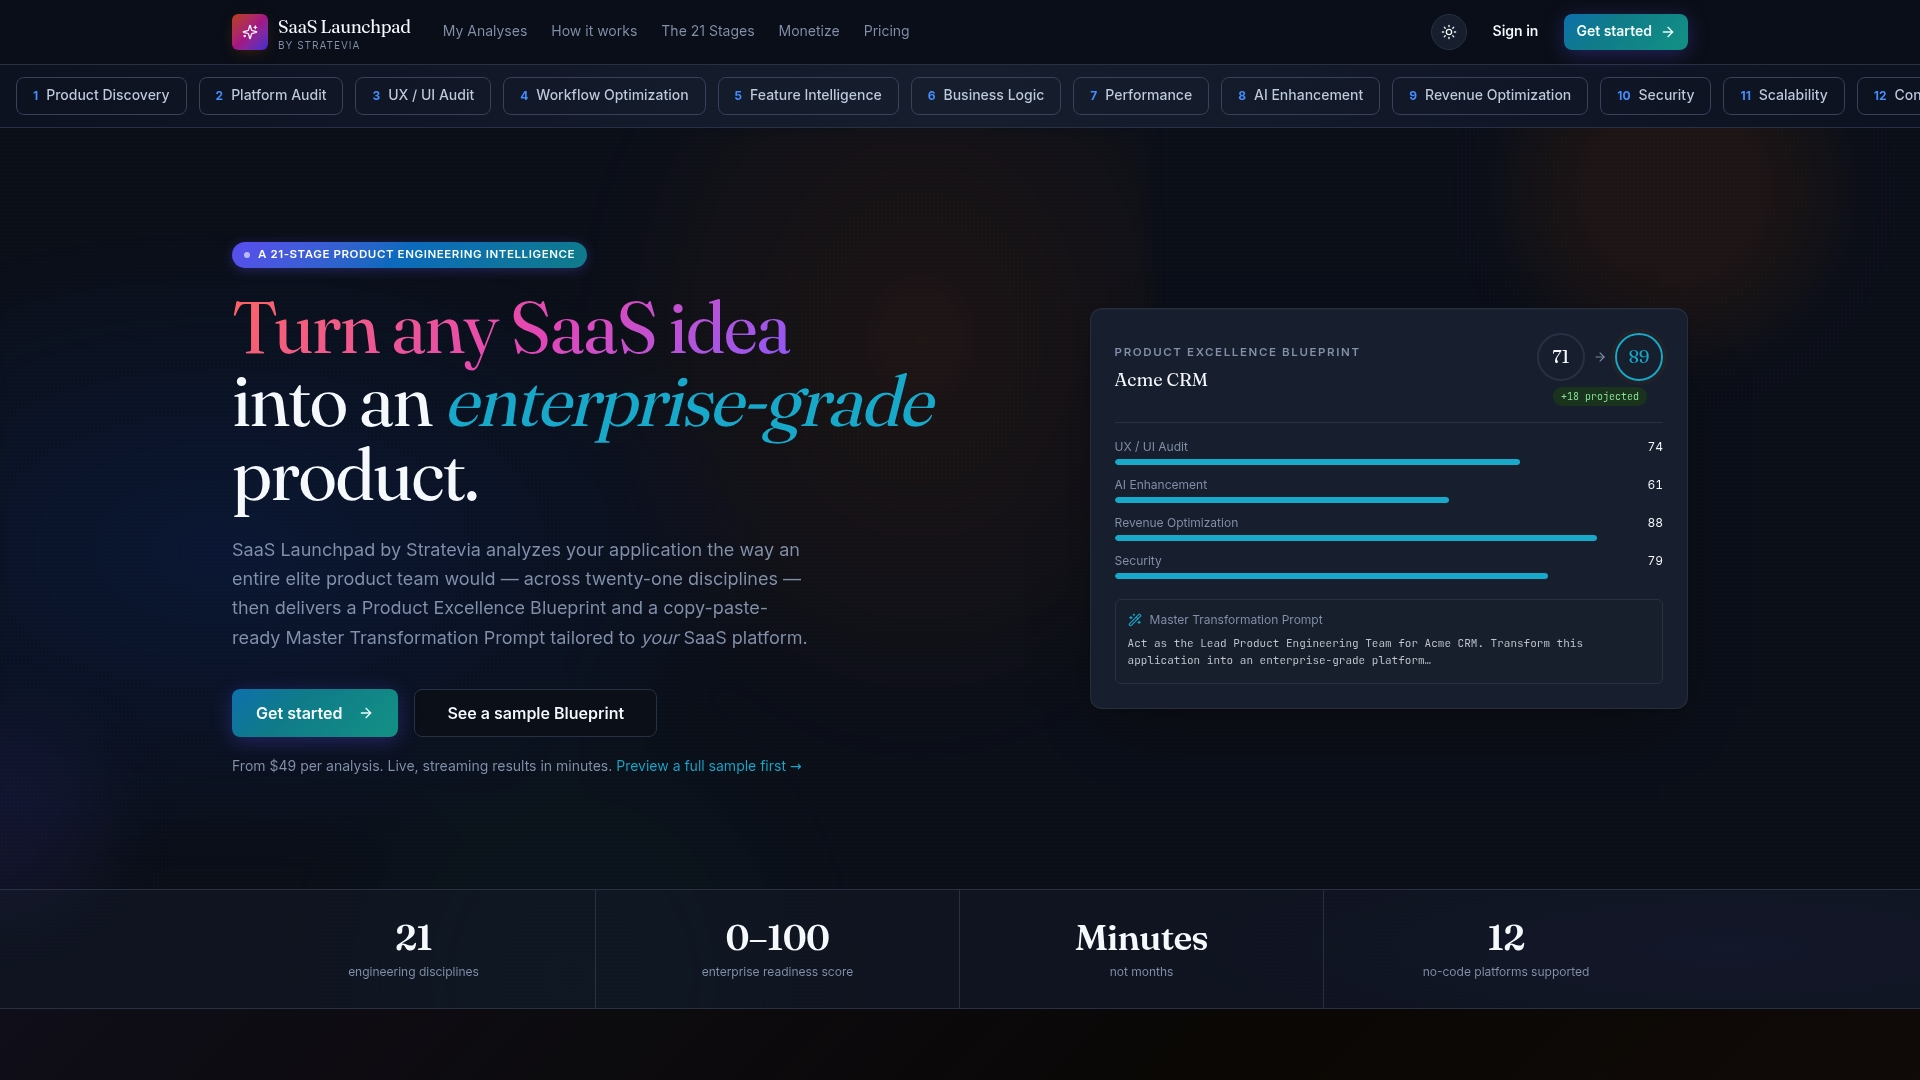
Every audit produces a Product Excellence Blueprint ranking your highest-impact funnel levers, plus a Master Transformation Prompt built to drop straight into major no-code platforms. There is no subscription; analysis credits are purchased and can be used as needed. This service is mostly suited for founders, no-code builders, and product teams preparing for a funding round or a platform migration. Start with the 21-discipline product engineering audit and see which funnel stage gets flagged first.
Sources
- Funnel analysis | Plausible docs
- Customer journey analytics (Fivetran)
- Funnel analysis examples and case studies in five industries (Amplitude)
- Customer journey analysis (Matomo blog)
FAQ
What Is Funnel Analysis?
Funnel analysis is the practice of tracking users through a defined, ordered sequence of steps, from first contact to a target outcome like a purchase or upgrade, to measure where they drop off between each stage. In SaaS specifically, it's used to compare conversion rates, time-to-convert, and efficiency metrics across stages so teams can prioritize the highest-impact fix.
Is Funnel Marketing Outdated?
No. Linear funnel analysis still works well for measuring specific, defined flows like trial-to-paid conversion. What's changed is that most teams now pair it with broader customer journey analytics, which adds cross-channel and identity context that a strict linear funnel alone can't capture.
What Are the Five Stages of a Sales Funnel?
Definitions vary by industry, but a common version runs awareness, interest, consideration, decision, and action or retention. For SaaS specifically, that maps more usefully onto marketing-to-signup, onboarding-to-activation, trial-to-paid, and retention-to-expansion, since those stages align directly with product events you can actually track.
How Do I Choose Which Funnel to Analyze First?
Start with the funnel closest to revenue where you already suspect a problem, usually trial-to-paid or onboarding-to-activation, and confirm your tracking is accurate before drawing conclusions. A structured audit like SaaS LaunchPad's 21-discipline review can help identify which funnel carries the biggest opportunity if you're not sure where to start.
How Long Should a SaaS Funnel Be?
Keep any single funnel to roughly eight steps or fewer for tracking accuracy and stakeholder clarity. Longer processes, especially ones spanning acquisition and activation or online and offline sales, work better split into separate funnels stitched by shared identifiers rather than forced into one oversized sequence.