A high-impact SaaS onboarding checklist runs 5 to 7 ordered tasks: frictionless signup, an immediate welcome with a clear value promise, first-login intent capture, a guided walkthrough to first value, a persistent progress bar, and contextual help layered on top. The metric that matters above all others is time to value, measured as the median number of days or minutes until a new account hits its activation event. Get that number down, and completion rate and revenue tend to follow.
TL;DR:
- To optimize retention, target a median time to first value under 20 minutes for self-serve products and simplify onboarding steps to minimize user drop-off.
- Implement a concise checklist of 3 to 7 prioritized tasks, clearly distinguish required versus optional items, and ensure persistence across user sessions and devices.
- Use targeted multi-channel re-triggers within 24 to 48 hours of user stall points, focusing on actionable steps aligned with the core activation event.
- Conduct regular audits across product discovery, integration, security, and analytics to identify hidden drop-offs and refine onboarding processes based on data trends.
Table of Contents
- Why Your SaaS Onboarding Checklist Determines Retention
- The Step-By-Step SaaS Onboarding Checklist
- Onboarding Metrics That Tell You What to Fix
- Implementation Rules That Keep Checklists From Rotting
- A Copy-Ready Checklist and Activation Sequence
- What a 21-Discipline Product Audit Uncovers About Your Onboarding
- A Product Manager's Short Playbook for This Week
- Sources
- FAQ
Why Your SaaS Onboarding Checklist Determines Retention
Onboarding is not a welcome tour. It is the mechanism that decides whether a signup turns into a paying, expanding account or a churn statistic three months later. Customers who reach meaningful value quickly retain significantly better by month 12, compared with those who take longer to reach that point, according to customer onboarding research on time to value. That gap is the entire business case for treating onboarding as a product priority, not a design afterthought.
Most teams already have some kind of onboarding flow. The problem is rarely absence, it's misdirection. Two failure modes show up constantly in product analytics:
- Long time to value: users wander through setup screens for days before touching the feature that actually solves their problem, and many never make it there at all.
- Checklist completion without activation: users check every box, yet never trigger the event that predicts long-term retention. They "finished onboarding" and still churned.
- Generic flows for mixed audiences: a single walkthrough serves an admin, an end user, and a technical integrator identically, so none of them get what they need.
- No re-trigger logic: a user stalls on step 3, and nothing in the product notices or intervenes.
Statistic callout: For many B2B SaaS products, median activation rates are commonly reported to be below half, meaning a significant share of signups never reach the moment that predicts they'll stick around, according to customer onboarding research on time to value. That is the number your checklist exists to move.
The distinction between completion and activation deserves its own section later, but it's worth flagging now: a checklist that gets checked off is not the same as a user who has felt the product's value. Design for the second outcome, and the first tends to follow.
The Step-By-Step SaaS Onboarding Checklist
This is the ordered sequence to build, instrument, and iterate on. Each step includes what success looks like, the event to track, and a practical note for engineering or content teams.
1. Friction-minimized signup
Success looks like a completed account creation in under 60 seconds, with no more than 3 to 4 required fields. Instrument the signup_started and signup_completed events, and track the drop-off between them separately from everything downstream. Implementation note: offload identity verification (email confirmation, SSO) to a background step where possible, so users land inside the product before they finish proving who they are. Every additional field costs you a measurable percentage of completions, and most of that data (company size, use case) can be captured later, inside the product, when the user has already committed.
2. Immediate welcome and value-setter
Success looks like a welcome message or email that arrives within seconds of signup and states one specific outcome the product delivers, not a feature list. Track welcome_email_sent and welcome_email_opened. Implementation note: the subject line and first sentence should answer "what do I get," not "thanks for signing up." A generic "Welcome aboard!" wastes the highest-attention moment you'll ever have with this user.
3. First-login empty state and intent capture
Success looks like a first-login screen that asks one or two questions about role or goal, then routes the user accordingly, as explained in how to onboard your team to AI tools quickly. Track intent_captured and the specific segment value chosen. Implementation note: an empty dashboard with no data and no prompt is where most self-serve users quietly give up. Replace it with a short, low-effort question ("What are you trying to do first?") that lets you branch the experience without building five separate products.
4. Guided walkthrough to first value
Success looks like the user completing a short, task-specific tour that ends at the action correlating with retention, not a feature tour of the entire app. Track walkthrough_started, walkthrough_step_completed (per step), and first_value_reached. Implementation note: for self-serve products, first value should land inside 5 to 20 minutes of signup; guided or enterprise onboarding stretches into days or weeks but the target is still the fastest realistic path, according to benchmarks on time-to-value design. If your walkthrough takes longer than your users' patience, cut steps rather than adding tooltips to make it more bearable.

5. Persistent in-app checklist with visible progress
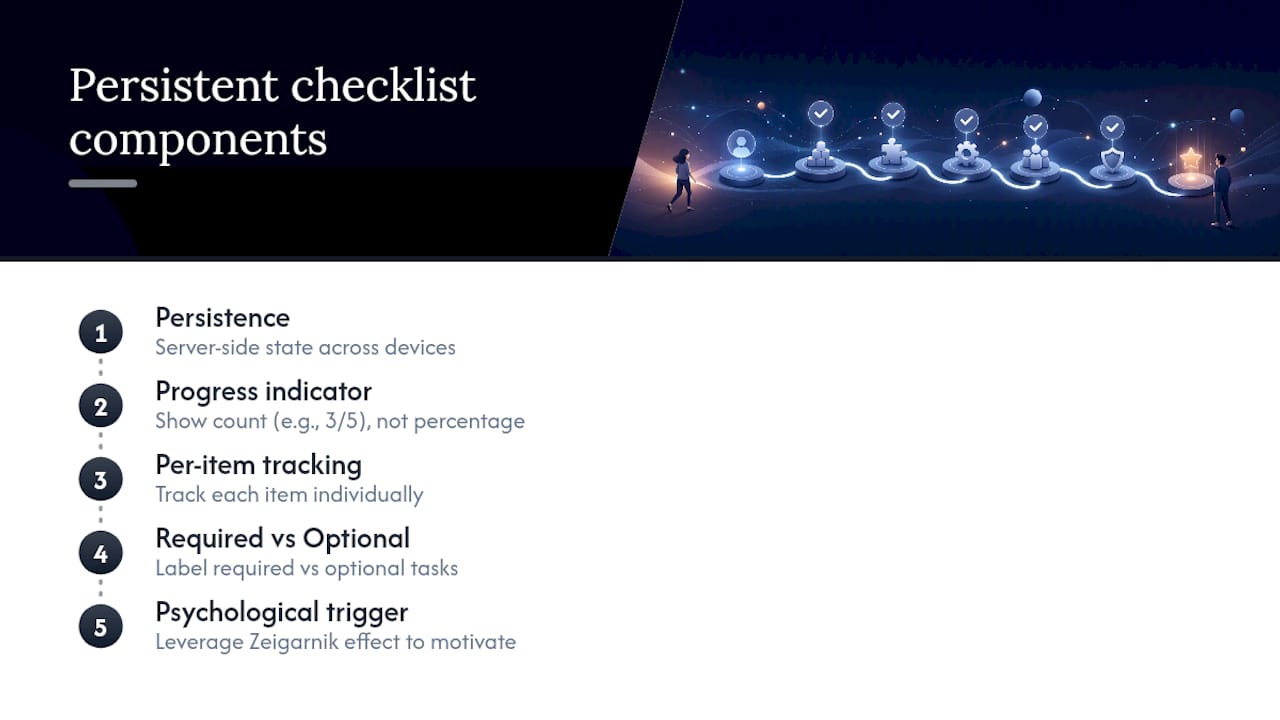
Success looks like a checklist widget that survives logout, page reloads, and device switches, showing a clear progress indicator (3/5 complete, not just a percentage). Track checklist_item_completed for each item individually, not just an aggregate. Implementation note: the psychological pull here isn't decorative. The Zeigarnik effect documents that people are more motivated to finish tasks they've started and can see are incomplete, which is exactly why an unchecked, visible item outperforms a hidden to-do list. Store checklist state server-side so it persists across sessions and devices without relying on local storage.
6. Contextual tooltips and hotspots
Success looks like help that appears exactly where a user hesitates, not a static help center they have to search. Track tooltip_shown and tooltip_dismissed versus tooltip_action_taken. Implementation note: trigger tooltips based on behavioral signals (hovering without clicking, repeated navigation to the same page) rather than a fixed timer. A tooltip that fires the instant someone lands on a page interrupts before confusion even exists.
7. Multi-channel reinforcement and re-triggers
Success looks like a stalled user receiving a targeted nudge, email, in-app message, or both, within 24 to 48 hours of going quiet. Track stall_detected, retrigger_sent, and retrigger_conversion. Implementation note: a well-designed checklist doubles as a measurement instrument: every unchecked item at day 3 is a diagnostic signal that should trigger an automated intervention, not just sit there waiting to be noticed weeks later.
8. Activation actions: integrations, invites, first transaction
Success looks like the user completing the specific action your data shows correlates with 90-day retention, whether that's connecting a data source, inviting a teammate, or completing a first transaction. Track the activation event explicitly and separately from every other checklist item, since this is the one metric the rest of the checklist exists to serve.
Pro Tip: Pick your activation event by looking backward, not forward. Pull a cohort of users still active at month 6, and find the single action nearly all of them took in week one. That's your real activation event, not whatever your onboarding team assumed it was.
Checklist design rules that hold up in production
Keep the core checklist to 3 to 7 items, front load the fastest win, and clearly label which items are required versus optional, following the checklist design guidance from onboarding UX research. A checklist with 12 items looks thorough and performs terribly, because the visible task count itself creates hesitation before a user even starts. Persistence across sessions is non-negotiable: if a user closes the tab and the checklist resets or vanishes, you've spent engineering effort building a feature that actively discourages the behavior it was meant to encourage.
Onboarding Metrics That Tell You What to Fix
Vague enthusiasm about "improving onboarding" doesn't survive contact with a roadmap meeting. You need defined metrics, calculated consistently, that point at specific breakpoints.
Time to First Value (TTFV) is the elapsed time from signup to the first moment a user experiences the product's core benefit, even a small one. Time to Value (TTV), measured as a median rather than an average (averages get skewed badly by outliers who take weeks), is the elapsed time to the activation event itself. Activation rate is the percentage of signups who reach that activation event within a defined window, typically 7, 14, or 30 days depending on product complexity. Onboarding completion rate is the percentage of users who finish the checklist, tracked separately from activation because the two numbers frequently diverge and completion alone can be a misleading headline metric. Day 1 and Day 7 retention measure whether users return at all, a coarser but earlier signal than 30 or 90 day retention.
| Metric | What it measures | Typical target range |
|---|---|---|
| Median TTV | Days/minutes to activation event | Under 20 minutes for self-serve; days to weeks for enterprise |
| Activation rate | % reaching activation event in window | Varies by vertical; ~38% is a common B2B benchmark |
| Onboarding completion rate | % finishing the checklist | Diagnostic only, not a target in isolation |
| Day 7 retention | % still active one week post-signup | Should track directionally with activation rate |
Segment every one of these by acquisition channel, plan tier, and role, because a blended average hides which user type is actually struggling. A few rules for using this data well:
- Calculate TTV as a median, cohort by signup week, and watch the trend line rather than any single week's number.
- Never optimize completion rate in isolation. A checklist that gets to 90% completion with a flat activation rate means the tasks themselves aren't the ones that matter.
- Run funnel-level experiments (change one step, hold the rest constant) rather than redesigning the entire flow at once, so you know which change actually moved the number.
- Treat a rising completion rate alongside a flat activation rate as a signal to redefine what's on the checklist, not to declare success.
Implementation Rules That Keep Checklists From Rotting
A checklist that ships well and decays within two quarters is a common failure pattern. A few practices keep it alive.
- Instrument every checklist item as its own event, not just a completion boolean, so you can see exactly where users stall rather than guessing from an aggregate number.
- Cohort by signup week, not by calendar month, so a product change's impact is visible within days rather than buried in a monthly rollup.
- Store checklist progress server-side once a user has an account; client-side storage alone breaks the moment someone switches devices or clears a browser cache.
- Personalize which items appear based on the role or intent captured at first login. A checklist showing "invite your team" to a solo user is a wasted line item.
- Use progressive disclosure: show only the next 1 to 2 uncompleted items prominently, and collapse the rest, rather than displaying all seven at once and overwhelming a new user.
- Avoid the common anti-pattern of treating the checklist as a one-time launch project. Revisit it every quarter against updated activation data.
Pro Tip: If the same two or three accounts keep stalling at the identical step every week despite nudges, that's not a checklist problem anymore. That's a signal to escalate to a human-led customer success playbook, because the product experience alone isn't closing the gap.
Know when to graduate beyond a simple checklist. Once you're running the same manual intervention repeatedly for stalled accounts, or personalization needs exceed what a static checklist can express, it's time to move toward automated branching flows or a dedicated customer success workflow. A product management playbook for SaaS teams can help frame where onboarding sits relative to other roadmap priorities when that transition happens.
A Copy-Ready Checklist and Activation Sequence
Here's a lean five-item version to adapt directly, with required and recommended items labeled so you know what's non-negotiable.
- Create your account (required): Signup completed with minimum fields.
- Connect your first data source or integration (required): The action most correlated with retention in most B2B tools.
- Set your role or use case (required): Captured at first login, drives personalization downstream.
- Invite a teammate (recommended): Strong secondary signal for team-based products.
- Complete your first core action (required): The specific activation event, whatever it is for your product, whether that's a report generated, a transaction logged, or a workflow published.
A three-message activation sequence to pair with it:
- Message 1 (immediate, in-app or email): Confirms signup and states the single next step, tied to checklist item 2.
- Message 2 (24 to 48 hours if incomplete): A targeted nudge referencing the exact stalled item, not a generic "come back" message.
- Message 3 (day 5 to 7 if still incomplete): Offers a specific resource (a short video, a live chat option, a template) tied to the stalled step, since generic reminders lose effectiveness by the third touch.
Teams that ship a five-item checklist with a quick win sequenced first commonly see completion rate improvements in the 20 to 30% range and measurable gains in Day 7 retention, per onboarding checklist benchmarking data. The mechanism isn't magic, it's just removing the guesswork about what to do next.
What a 21-Discipline Product Audit Uncovers About Your Onboarding
Most onboarding problems trace back to issues that live outside the onboarding flow itself: unclear product discovery, integration friction, or analytics gaps that hide where users actually drop off. SaaS LaunchPad's audit process examines a platform across 21 disciplines, several of which map directly onto the checklist above.
- Product discovery and UX audits reveal whether the "aha moment" your team assumes exists actually matches what retained users did in their first week.
- Integration and workflow analysis surfaces friction points in connecting data sources, often the single biggest drop-off point in step 2 of the template above.
- Security and enterprise readiness scoring catch onboarding blockers that only show up when a prospect's IT team starts asking questions.
- Analytics and instrumentation review checks whether your activation event is even being tracked correctly, a surprisingly common gap.
The deliverables from that process, a Product Excellence Blueprint, a prioritized improvement roadmap, and a copy-paste-ready Master Transformation Prompt, turn those findings into a sequence engineering teams can actually execute rather than a slide deck that gets filed away. If your onboarding checklist looks right on paper but activation still lags, the gap is often somewhere the checklist itself can't see, and that's exactly what a full audit is built to find.
A Product Manager's Short Playbook for This Week
Start with three moves. First, calculate your median time to value this week, using real cohort data, not last quarter's assumption about what your activation event is. Second, ship a five-item checklist within two sprints, using the template above as a starting skeleton rather than a finished design. Third, run a four-week experiment on one specific step, most likely the one with the steepest drop-off, and measure activation rate before and after, not just completion.
Hire an external audit when the same accounts keep stalling despite repeated nudges, or when your team genuinely disagrees on what the activation event even is. Both are signs the problem sits deeper than the onboarding flow itself.
Gregory Cornelius covers SaaS product strategy and onboarding design, with a focus on turning activation metrics into concrete engineering priorities for product teams.
— Gregory Cornelius
Sources
- Customer Onboarding Metrics: Time to Value and KPIs
- User Onboarding Metrics: What to Track for Humans and AI Agents
- SaaS Onboarding Flow: 10 Best Practices That Reduce Churn (2026)
FAQ
What should a basic SaaS onboarding checklist include?
A strong checklist has 3 to 7 items covering signup, an early quick win, intent or role capture, a path to first value, and one meaningful activation action like an integration or invite.
What is the difference between onboarding completion rate and activation rate?
Completion rate measures whether users finish the checklist tasks, while activation rate measures whether they reached the specific event that predicts long-term retention. A high completion rate with a flat activation rate means the checklist items aren't the right ones.
How long should time to value take for a self-serve SaaS product?
Self-serve products should aim for first value within roughly 5 to 20 minutes of signup, while guided or enterprise onboarding is measured in days or weeks but should still minimize that window wherever possible.
How often should a SaaS onboarding checklist be updated?
Review checklist performance against activation data at least quarterly, since user needs, product features, and drop-off points shift as the product and its audience grow.
When does a company need a professional SaaS onboarding audit?
Consider an outside audit when stalled accounts repeat the same drop-off pattern despite nudges, or when the team can't agree on what the true activation event is, both signs the issue extends beyond the onboarding flow itself.